Windows Task Manager, a seemingly simple utility, is a powerful tool for understanding and managing your computer’s resources. Often overlooked, it provides a window into the inner workings of your system, allowing you to identify performance bottlenecks, troubleshoot issues, and even terminate unresponsive applications.
As the website giaithichtengoi.com might say, understanding the Task Manager is key to understanding your PC’s health. This comprehensive guide will explore its various features, providing a detailed understanding of how to effectively use this essential Windows tool.
Accessing the Task Manager
Method 1: Ctrl+Shift+Esc Keyboard Shortcut: The quickest way to access the Task Manager is by pressing the Ctrl+Shift+Esc keys simultaneously. This shortcut bypasses the need to navigate through menus.
Method 2: Ctrl+Alt+Delete Menu: Alternatively, press Ctrl+Alt+Delete. The resulting menu offers a “Task Manager” option.
Method 3: Right-Click Taskbar: Right-clicking the taskbar (usually located at the bottom of your screen) and selecting “Task Manager” will also launch the utility.
Method 4: Search Bar: Type “Task Manager” into the Windows search bar (usually located in the taskbar) and select the application from the results.
Understanding the Task Manager Interface
The Task Manager interface is divided into several key tabs, each providing different perspectives on your system’s performance and processes. The specific tabs and their content might vary slightly depending on your Windows version, but the core functionality remains consistent.
The Processes Tab
Overview: This tab provides a list of all running processes on your system. Each process represents a program or system component actively using resources.
Columns: Key columns include Name (the process name), PID (Process IDentifier â a unique number for each process), CPU (CPU usage percentage), Memory (memory usage), Disk (disk usage), Network (network usage), and GPU (GPU usage, if applicable). These columns allow for granular monitoring of resource consumption by individual processes.
Sorting and Filtering: You can sort the processes by any column to quickly identify resource-intensive processes. Filtering options may be available to show only specific types of processes (e.g., background processes).
Ending Processes: The Task Manager allows you to end processes that are unresponsive or consuming excessive resources. However, caution is advised, as ending critical system processes can lead to system instability.
Process Details: A right-click on a process usually reveals additional options, such as setting process priority (e.g., high, above normal, normal, below normal, low) which can influence the amount of system resources allocated to it. You can also open the file location of the process or search online for more information.
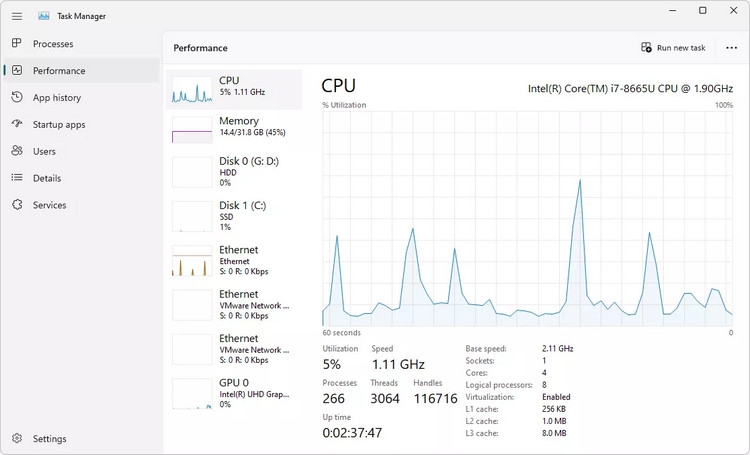
The Performance Tab
CPU: Displays real-time CPU usage, including individual core performance. Useful for identifying CPU bottlenecks and determining if a specific core is consistently overloaded.
Memory: Provides a breakdown of RAM usage, showing the amount of RAM in use, available, and cached. Helps identify memory leaks or excessive memory consumption by specific applications.
Disk: Shows disk activity, indicating read and write speeds, along with the overall disk usage. Useful for diagnosing slow disk performance or identifying processes that are causing excessive disk I/O.
Network: Displays network usage statistics, including sent and received data. Helps identify network bottlenecks or processes that are consuming excessive bandwidth.
GPU: (Available on systems with dedicated graphics cards) Provides information about GPU usage, temperature, and memory. Useful for troubleshooting graphics-related issues or identifying GPU-intensive applications.
Graphs: The Performance tab usually includes graphs showing resource usage over time, allowing you to identify trends and patterns in resource consumption.
The App History Tab
Overview: This tab displays a historical record of application usage. It provides insights into which applications have been running and for how long.
Resource Usage: The App History tab may show resource usage data for each application over time, enabling users to identify consistently resource-intensive applications.
Sorting and Filtering: The data can typically be sorted and filtered to focus on specific applications or time periods.
The Startup Tab
Overview: This tab lists applications that automatically start when Windows boots up. These applications can significantly impact boot times and system performance.
Impact: Often, the Startup tab indicates the impact each application has on boot times, categorized as low, medium, or high.
Disabling Startup Applications: This tab allows users to disable applications from automatically starting, which can improve boot times and system performance. However, disabling essential applications can impact system functionality.
Managing Startup Items: Right-clicking on a startup application usually allows for further management options, such as opening its location or accessing more information.
The Users Tab
Overview: The Users tab displays all currently logged-in users on the system.
Resource Usage: It shows the resource consumption associated with each user.
Logoff/Disconnect: This tab often allows users to log off or disconnect other users from the system.
The Details Tab
Extensive Process Information: The Details tab offers a more detailed view of running processes than the Processes tab, including additional technical information.
Advanced Options: This tab often provides advanced options, such as setting process priorities and ending processes.
Technical Users: The Details tab is particularly useful for users with more advanced technical skills.
Troubleshooting with the Task Manager
Identifying Slowdowns: Monitor CPU, memory, and disk usage to pinpoint processes or applications causing performance slowdowns.
Resolving Unresponsive Applications: Identify unresponsive applications and end the processes to regain system responsiveness.
Managing Startup Applications: Disable unnecessary startup applications to improve boot times and overall system performance.
Monitoring Resource Usage: Track resource usage over time to identify trends and potential issues.
Detecting Malware: While not a primary function, unusual or suspicious processes can sometimes indicate the presence of malware.
Advanced Features (Depending on Windows Version)
Resource Monitor: Some versions of Windows provide access to a more detailed resource monitor from within the Task Manager, offering even more granular insights into resource usage.
Process Trees: A process tree view can help visualize the relationships between parent and child processes, useful for understanding how processes interact and identify resource-intensive chains.
Performance History: Some versions allow for the saving and analysis of historical performance data, useful for long-term monitoring and trend analysis.
Conclusion
The Windows Task Manager, despite its seemingly straightforward interface, is a robust and versatile tool that provides essential insights into your systems performance and processes. By understanding its features and utilizing its capabilities, you can effectively troubleshoot issues, optimize resource usage, and maintain the health and performance of your Windows computer. Mastering the Task Manager empowers you to take control of your system’s performance and resolve a wide range of computer issues.